Using grants data and UKGrantmaking for sector insights and benchmarking
Brought to you by:
By Ruth Jolley, Data Support Lead, 360Giving
Whether you are a large foundation or a small charitable trust, understanding your role within the wider grantmaking landscape is crucial. UKGrantmaking is designed to provide you with the data and insights to do just that.
Use the following guide to help answer questions like:
- Who are my peers?
- How does the grantmaking for my type of organisation compare to the wider sector?
- How does my grantmaking compare to others?
- How does the change in my grantmaking compare to my peers?
- Who else funds my grantees?
Part 1: Understand your position: benchmark against your peers
Understanding your place in the wider grantmaking landscape is the first step in effective benchmarking.
Find your organisation in UKGrantmaking
In UKGrantmaking, we have done our best to identify every grantmaker in the UK and assign them a category and segment.
More about categories and segments
Review the methodology to find out more about how each category and segment is assigned. We have applied categorisation based on the readily available data and information, and we welcome your input. If you feel the segment assigned to your organisation doesn’t match the definition, please complete an amendment form.
For a quick way to find any organisation, you can download the full dataset. This is a comprehensive list of all included grantmakers. This download holds a wealth of information. Alongside financial data, you’ll find data from charity regulators on how, what and who each grantmaker is registered to fund, their area of operation, and their geographic location. Use this download to search or filter by name or charity/company number to find your own record, including your assigned category and segment and grantmaking details.
Who are your peers?
The download can help you to identify your peers: for example, those within the same segment, those with a similar grantmaking spend, those with similar areas of operation, or those funding similar work using the regulator classifications.
Look at your segment and explore trends
Once you’ve found your organisation, the value comes from contextualising your grantmaking within your segment, your peer group and the wider sector.
First, access the overview of the category you’re in using the menu on the left-hand side. The UKGrantmaking platform provides charts and tables that help you compare your segment against the rest of the category and the wider sector.
How large is your segment? How many organisations are in the segment?
For example…
If you are a Family Foundation, in the 2025 edition, the Trusts & Foundations overview shows you that the segment’s grantmaking totalled £2.1 billion across 294 organisations. You can then compare those figures to the total grantmaking of the other segments in the Trusts & Foundations category, as well as the grantmaking of Trusts & Foundations as a whole.
Next, explore the summary tables to understand year-on-year trends.
How has the grantmaking changed over time? How does the change in your grantmaking compare to organisations that are a similar size or type to your organisation?
For example…
Continuing with Family Foundations, we see that the segment’s year-on-year growth in 2023-24 was 10%, a figure that exceeded inflation, which was around 6% for the period, but is largely in line with the overall Trusts & Foundations category.
Explore the segment overview further, which features:
- A summary of the largest organisations in each segment
- An interactive table of those organisations
- Commentary about the segment.
Who are the largest grantmakers? What has driven the change? How does that compare to other segments?
For example…
The data for the largest 100 Family Foundations shows their combined growth was 12%, ahead of the segment’s overall increase of 10%. The commentary explains that the four largest family foundations – Children’s Investment Fund, CH Foundation, Arcadia, and Leverhulme Trust – collectively increased grantmaking by over £200m.
Understand your organisation in context
So, you now have a good understanding of what happened in the segment. How does that compare to your organisation?
Use the interactive tables and the full data download to view your position or rank within the segment or the category for the year.
Who are your peers with similar levels of grantmaking? How has your position changed year-on-year? What changes can you see in your peers? How does that compare?
Also, have a look at the size of grantmakers chart, where would you appear on this chart?
For example…
If your Family Foundation has grantmaking over £10m, the analysis shows you are one of the largest 10% of Family Foundations and the largest 1% of all grantmakers.
You can also explore endowment levels and see how they have changed across the years.
Do you see similar trends in your organisation? Which other funders hold similar value endowments?
There’s much more you can do with the wealth of data available in the full download. For example;
- Consider examining your ratio of grantmaking to total expenditure and how it compares to that of your peers.
- Compare payout rates and understand the drivers compared to your peers. You can read more about this in our blog.
- Review staffing levels and look at the ratio of employees to grantmaking expenditure
Just note that the availability of data varies depending on the size and source of the information, so not all fields are available for all organisations. The absence of a value in the data sheet does not mean it is zero – it might mean that the information isn’t available.
Part 2: Benchmark your grants and recipients
Now, for the next level of analysis! Thanks to grantmakers who publish their grants data openly, we can dig even deeper into who and what is being funded, and by how much. Just as you compared your organisation to the wider sector, you can do the same with your grants data.
For this next step, you will need some data about your grantmaking. This includes the number of grants, the amount awarded and the size of the recipient organisation, which hopefully you can find in your systems. If you’re a 360Giving publisher, our free tools GrantNav and GrantVis will make these summaries even easier. If you’re not, check out our support and guidance. There’s never been a better time to get involved.
Explore recipient organisation profiles
Where grant recipients are registered charities, we can use data from the charity regulator registers to look at the size of organisations that have received grants.
Using your own data or, if you’re a 360Giving publisher, using GrantNav and GrantVis. You can profile your own grantmaking by recipient size and compare your profile against the rest of the segment.
For 360Giving publishers, this can be done in a few simple steps:
- Visit GrantNav, our free search engine for open grants data
- Using the Funding Organisation filter on the left-hand side, filter to your organisation name.
- Using the Award Date filter, found partway down on the left-hand side, apply an award date filter. For UKGrantmaking, we examine grants between April and March of the financial year in question.
- Select ‘Visualise your search results in GrantVis‘ above the search results, to visualise your grantmaking.
- Navigate to the bottom of the GrantVis page to find the ‘Latest income of charity recipients‘ chart
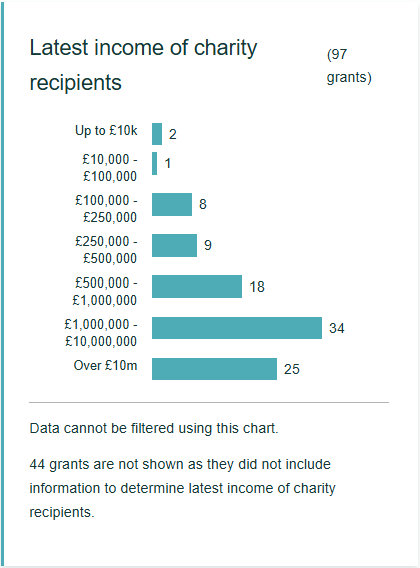
- Collate these numbers into the bands you see in the UKGrantmaking ‘Size of recipients’ chart (e.g Under £10k, £10k-£100k etc.) and calculate the number of grants in each band as a percentage of the total.
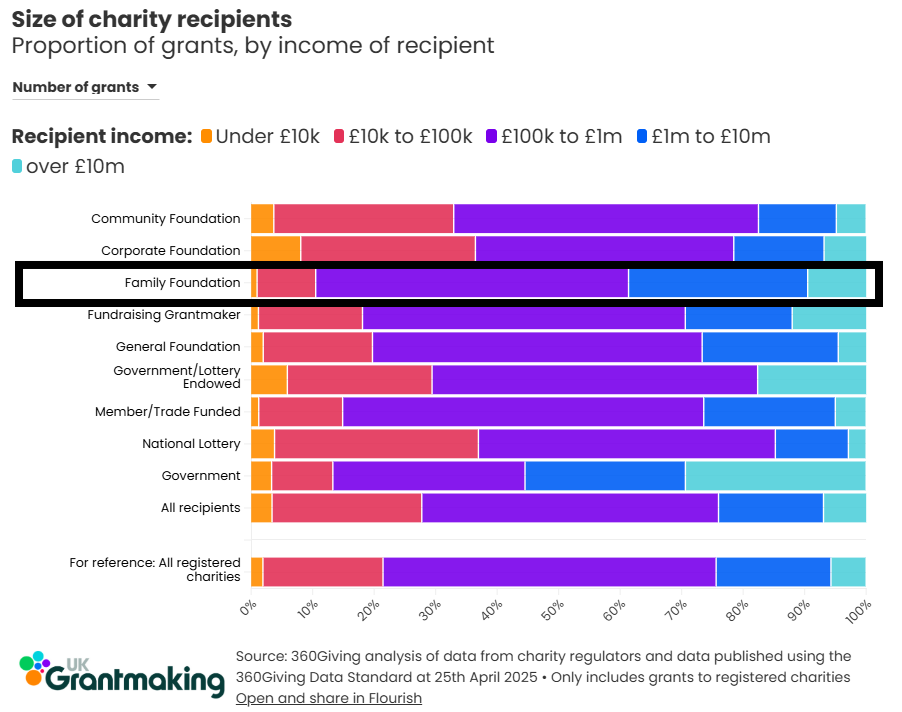
- Compare your results to those of the segment and totals in the ‘Size of recipients’ chart in UKGrantmaking.

What’s the profile of your recipients compared to the segment? Are you funding larger or smaller organisations? How does that compare to the profiles of all registered charities?
Look at the size of the grants
You can perform a similar exercise by examining the size of grants.
For 360Giving publishers, follow the above steps, but use the results from the ‘Award amount‘ chart found on GrantVis to collate your results into the bands used in UKGrantmaking.
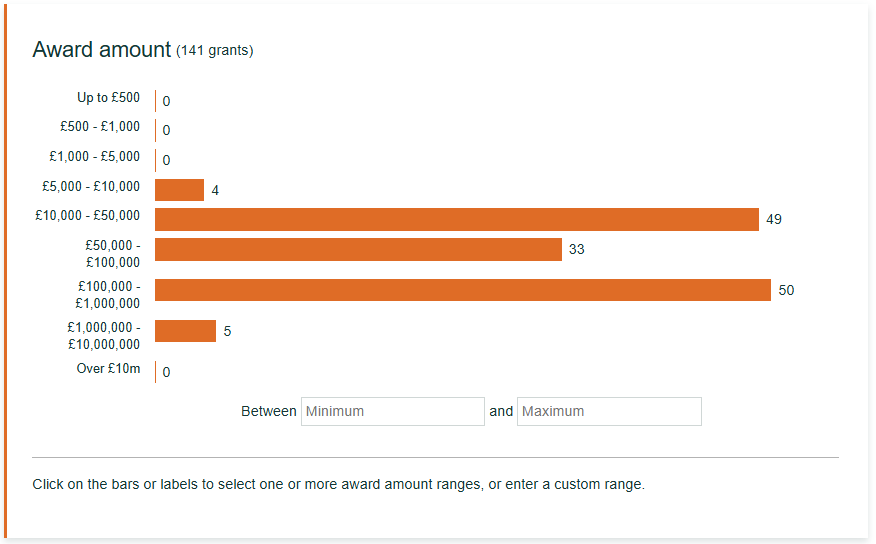
Calculate these as percentages and then compare them against your segment and the total this time in the UKGrantmaking Grant amount chart.

These are just a couple of quick ideas for benchmarking that you can do yourself using the UKGrantmaking platform. There is much more that you can do depending on what data you have available. If you’re unsure where to start or would like to ask us a question, book a data support call.
Part 3: Find out who else funds your recipients
As you’ve seen with the benchmarking, understanding who is in the funding ecosystem with you is really important. It can help you identify potential collaborators and understand where changes in one funder’s strategy may impact another.
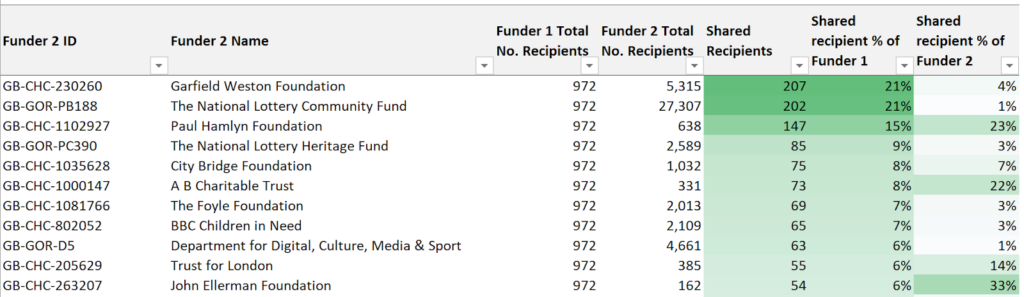
One of our most popular visualisations is the ‘Who funds with who’ chord diagram. It helps to demonstrate the interconnected nature of the funding landscape by showing how many recipients funders have in common. You’ll also see versions of it tailored to different groups of funders in the National Lottery, Focus: London and Grant Recipients sections of UKGrantmaking.
If you’re a publisher, you can dig deeper into the data behind the visualisations. Upon request, we can provide you with a detailed spreadsheet that shows the overlap, i.e., the number of grantees you have in common with other funders. To highlight the respective significance of these overlaps, we represent them as a percentage of your total grantees, as well as a percentage of the other funder’s grantees.
This means you can see not only which other funders are likely to impact you and your grantees, but also where changes in your strategy might impact other funders. The spreadsheet enables you to explore the data further and delve deeper into the common recipients.
Imagine you’re starting to review your strategy and might need to make significant changes to a grant programme. You can use this to explore and see who else is funding your grantees. You may find potential collaborators or organisations that could be negatively impacted by the changes you plan. Either way, it can open up conversations to work closer together on the changes.
If you would like to receive a ‘grantees in common’ profile for your organisation, please email our helpdesk to request it.
Want to go even further?
If you’d like our help or are interested in exploring the grantmaking landscape of a particular group of recipients, geographic area, or benchmarking against a funding group, we also provide benchmarking, consultancy, and analysis services.